Map Making by Cartographer, John Nelson
What is cartography? According to Wikipedia, the definition of cartography is:
″the study and practice of making maps. Combining science, aesthetics, and technique, cartography builds on the premise that reality can be modeled in ways that communicate spatial information effectively.″
The ancient art of mapmaking has taken a giant leap forward over the last few decades with the advent of computers. The leader of this field is Esri. They provide the most sophisticated software tools used by individuals, schools, and industries to make their maps. They also provide a wide range of classes, seminars, and conferences teaching the public how to make maps by using their flagship product ArcGIS — ″the world′s most powerful mapping and analytics software″ as stated on their website.
Mr. John Nelson is one of the brilliant and knowledgeable instructors in this free online cartography course. He recently shared his insights on map makings with our readers. From his personal testament, we can see how map making has evolved. Enjoy!

Q: What got you interested in making maps? What interests you the most about map making?
A: I was raised in a family of teachers. My father was a geography professor and my mother was a middle school teacher of art, geography, and history. When summer rolled around the family (including my three older siblings) would pile into a car and road trip around the country. So when I was in college and unsure of what sort of classes I should be taking (I originally thought I might be an eye doctor, after an experience with an eye injury as a child) I naturally drifted towards geography. My first cartography course at Central Michigan University was a magical sort of eye opener for me. I had always loved geography and art and I stumbled right into the intersection of those two things. I knew at the end of that semester just what I wanted to focus on and I thoroughly enjoyed the rest of my time there.
Many years later, working as a user experience designer for a small software company, I felt myself increasingly detached from the joy of making. The fine abrasion of requirements documents and deadlines wore down my sense of satisfaction until I felt rather hollow in the part of me that, apparently, needed some unbounded exploration and the pleasure of making for one′s self.
Longing to make maps again (I figure it had been maybe five years since I′d actually made a map), I just went for it in stolen moments between projects and meetings. It was the best sneaky creative activity I could have prescribed myself and I reveled in not only the making, but in sharing how and why I′d made it, via blog posts. It was an opportunity to be a bit of a teacher myself and it felt right. I was re-energized and surprised at the extent that it rejuvenated my work in other areas, as well. My employers, though, initially didn′t think much of the increased time I was spending at it! I remember being called into the owners′ office and told I was spending a ″lot of time on the blog.″ Fortunately, shortly thereafter a map I′d made went viral (I feel silly saying that, but it did) and I found myself in the same office being asked to perhaps increase my blogging to ″at least once a week.″ If it weren′t for that bit of timely luck I don′t know where I′d be today. I′m sure I′ve been ″unlucky″ in just as many ways, but how would I know!
So I suppose I make maps because I must. I′m interested in it because it affords my imagination a place to wander and feeds my want to make something. All work is sacred and I am just blasted by how fortunate I am to have a role that is supportive and accommodating of that opportunity to create and be inspired by the things that other map makers are creating.
Q: What are the crucial elements in making a map?
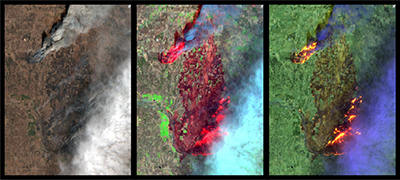
A: It′s tempting to provide a run-down of cartographic principles here, but for sure the most important bits are emotive qualities intrinsic to the map maker. I suppose a strong sense of empathy is a must when creating a successful map. To be able to wrap yourself in a phenomenon and understand it in a way that can then be represented visually means that you can share a visual representation of things as varied as drought, or migration, or mortgages, or pollution in a way that may be just seems to fit. A side benefit is that the resulting maps will be quite varied in their style and approach, which is a fun byproduct of the adventure.
But empathy doesn′t come without first being curious. So a willingness to try new techniques, to learn more about a phenomenon, to keep the question of ″why″ front and center, is at the heart of any good map.
Q: Please tell us some of your favorite cartographers from the 19th or early 20th century (pre-computer age) and why?
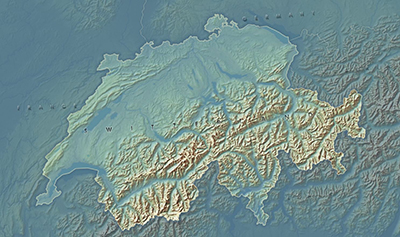
A: I′m sure I am not alone in my admiration of two remarkable cartographers from the early-to-mid 20th century, Erin Raisz and Eduard Imhof. Raisz′s playful geologic cross-section of a continent with pastels on packaging paper is evidence of an artist′s fluid mastery of their craft. Imhof′s impressionistic painting of the topography surrounding Walensee lake is a riveting example of how an artistic exaggerated impression of a place can more effectively describe a place′s exceptional beauty.
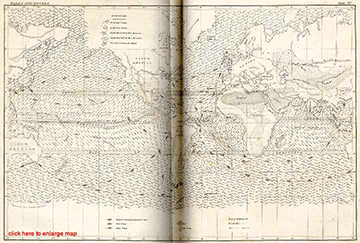
From an information mapping perspective, I am amazed by the work of Matthew Maury and the incredible number of data dimensions he was able to communicate at a time when data collection was a ghostly ephemera is almost disquieting. I learned of him because a chapter in the novel Moby Dick was devoted to describing a seasonal whale-sighting map of his.
The Twitter stream of the Library of Congress′ map division is a never-ending feast of inspiration from cartographers of the past. I am sort of new to looking back at historic maps and finding inspiration from them. It′s a relatively recent development for me so I tend to only know the ″hits.″
Q: Are there any aspects of map making that are underappreciated by the general public?
A: The general public sees a good map and ought to be motivated to action or to ask good questions. So in that sense hopefully the effort of preparation and analysis and design are overlooked by the viewer. This is ironically the best result for a cartographer. I heard once that the perfect film score is one that isn′t noticed. Maybe there′s something similar to maps, and I′m happy for the public to underappreciate my efforts if they are instead engaging with a phenomenon.
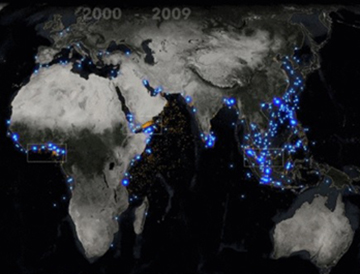
Actually, one aspect of map making that is underappreciated by the general public is how pervasive the need for maps and spatial analysis is today. I am often asked by puzzled conversationalists, presuming the age of exploration mapped everything, what exactly has to be mapped. Data has to be mapped. Things that move. Things that need to broadcast where they are compared to other things. Things you can′t necessarily see otherwise. Not just coastlines and borders.
Q: Do people still make maps by using paper and pencil or it is all digital now?
A: Absolutely! Hand-drawn maps are alive and well even in this digital time. Cartographers like Molly O′Halloran, Rick Lederer-Barnes, Heather Smith, and Sarah Bell have been making wonderful maps from the tips of their pens and brushes. And there is a thriving dimension within the art community that is creating tangible map products, like the exceptional work of Bettina Matzkuhn. In a hybrid sense, the illustration community represents a vibrant field of map makers who often use digital tools to imbibe the inherent charm and tactile quality of hand-drawn maps. For that matter, I′ve been working lots lately trying to pull textures into my maps that afford a hand-drawn quality while retaining the analytical and scalable benefits of a digital environment. Cartographers Dylan Moriarty, Warren Davison, Spyridon Staridas, and Wesley Jones have been undertaking similar hand/digital adventures. It′s a fun time.
Q: What is the relationship between data and mapping? How does digital mapping make it possible to incorporate data into map making? What kind of skills are required for the map maker in order to make a data-driven map?
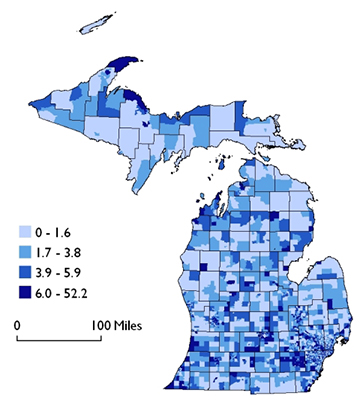
A: Maps are just data with some of the dust blown off them to reveal structure. Data is the raw material that evidences an underlying phenomenon. So it′s a middle-man in a sense, that fuels good questions, which drive visualizations.
Working in the digital environment is a massive resource for map making, since we can rely on a host of specific tools created to describe, refine, and create geographic data. It′s mostly a matter of trying things out and keeping a mental library of those experiences when tackling new projects.
Working with amazing colleagues at Esri has been a mega-exciting opportunity to learn from incredible thinkers, makers, and teachers. Getting to participate in the cartography MOOC coordinated by Ken Field is the perfect example of that.
Q: What are the challenges of making a 3D map vs. making a 2D map?
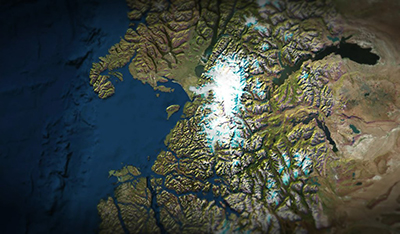
A: 3D is hard. Not just for the mapmaker, but for the map reader as well. Any map is just a model of the real world, stripped away of detail not related to the phenomenon being represented. A third spatial dimension introduces a lot of challenges like perspective and relational size (troublesome for comparative thematic mapping), occlusion (3D stuff gets in the way of other 3D stuff), and level of detail (at what rate does a map-reduce the content and precision of areas in the distance). But, some phenomena are wonderfully suited to 3D, like line-of-sight analysis (what can an observer see from any given point), depth and volume representation, or any representation where the third dimension adds emotive or analytical benefits greater than the challenges they invite along with. To see our shared Earth in its true spherical (nearly) form can have an emotional quality, an en-thingness, that a flat abstraction misses out on. So while I generally think 2D first, there are instances where a 3D map is a good choice.
Q: Please tell us the most challenging aspects of making a map?
A: Sometimes you just don′t have it in you to dive wholeheartedly into a project. Being in a rut or tapped of creative energies has got to be one of the biggest challenges for any maker. Every act of creation is personal; you pour a bit of yourself into everything you make. If for whatever reason, the fire is low then work can once more feel like a rote burden and lacking the intrinsic joy that comes with creation. I′m blessed that these times in my life have been temporary (though I wondered at the time), and thankfully rare. But the thinness of spirit happens, and I know it will happen again.
Q: I read your blogs on some of your projects. They are so informative and yet they are also artful. How do you decide on the subject for the maps you make; where do they come from?
A: Thank you! We live, for the most part, in a built environment. This means that nearly every interaction with our environment, whether it′s via a digital user experience, physical object, transportation infrastructure element, or garden, has been designed. In my field, it can be common to hear from map makers on the more analytical side of things say that they don′t design maps or that they aren′t cartographers. But anything that′s made is designed. And if you′ve made a map you have engaged in cartography. There is power in admitting that we are the makers of things used by others, regardless of our title, and it′s up to us to ensure that that use is honored and we do our best to imbibe all the communication and thoughtful utility that we can into these things we make.
I don′t have a consistent means of pinning down ideas for the maps I make. Sometimes I′m asked to look at a data set. Sometimes I stumble on it somewhat by chance. Often, though, in the process of making a map I invariably encounter another data set along the way or want to try a different visualization technique, so that each map sort of begets the next in a fun chain of creation. Recently, I′ve been especially influenced by interactions with my family (mom, dad, daughter, sister) that have resulted in some fun maps that I′m quite proud of. It′s a privilege to be able to weave these experiences into my work in this direct sort of way.
Q: What has mapmaking taught you about yourself and the world at large?
A: Making maps gives me the experience of relating to, and describing, very large things and very small things. I can′t help but, in that context, feel a sense of brevity for my time here and the smallness of my place in the world. On the other hand, the amazing quality of the job I have is that I get to share tools and techniques with a wonderful creative class of people. I hear from them occasionally and see the work that they are doing that has been helped, in a small way, by the work I′ve done. And that′s an amazing reward.
Q: Do individual clients contact the company and describe what they want to get mapped?
A: Esri builds tools and provides data and learning resources so customers can make amazing maps themselves. We rarely actually build maps ourselves but prefer to create an environment where people have what they need to do their analysis, create their visualizations, and tell their stories. Part of what I get to do, though, is to use these tools to create maps and write about the process to encourage our customers and to push our products further. It′s amazing fun and I′m happy to get to it every morning.
Hope you find John′s illustration of cartography quite helpful. If you would like to learn more about John′s maps, you could click the link below.
View John′s Blog